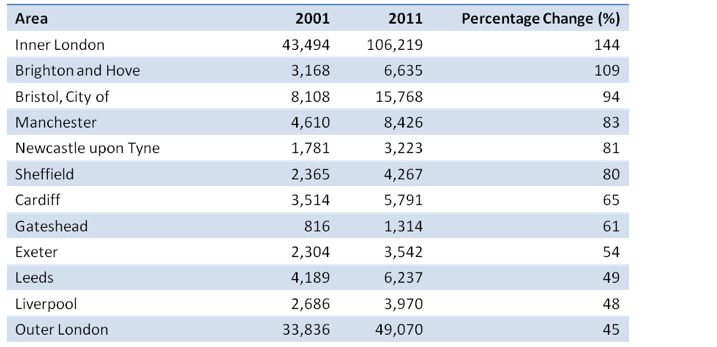
Choosing number to describe Tables
Trong task 1 của bài thi IELTS Writing, thí sinh có thể sẽ gặp dạng bài tables với nhiều thông số. Các bạn không thể viết về tất cả những số liệu này, vậy nên chọn số nào và trong bài nên nêu lên bao nhiêu con số? Dưới đây là lời khuyên cho dạng bài này và bài viết mẫu điểm 9.0 mà ArrowEnglish đã sưu tầm.
The table below shows changes in the numbers of residents cycling to work in different areas of the UK between 2001 and 2011.

Here are some advice for you:
Introduction: Don’t mention any numbers here
Overview
Don’t mention any numbers; just describe the main features/ overall trend
Paragraph 3
A description (and comparison) of the figures for Inner London and Outer London would probably be enough for this paragraph.
Paragraph 4
Maybe mention Brighton and Hove as the only area outside Inner London with a percentage change above 100%. We could also highlight Bristol as the second city in terms of cycling numbers. Finish with a general statement about the other areas (e.g. all below 10,000 residents cycling to work)

