
Sample Band 9 for Table 29.09
Dưới đây là bài viết band 9.0 cho bài hướng dẫn học IELTS Choosing numbers to describe tables
The table below shows changes in the numbers of residents cycling to work in different areas of the UK between 2001 and 2011.
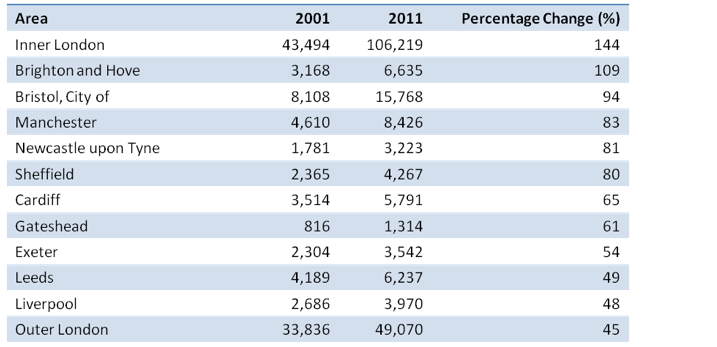
The table compares the numbers of people who cycled to work in twelve areas of the UK in the years 2001 and 2011.
Overall, the number of UK commuters who travelled to work by bicycle rose considerably over the 10-year period. Inner London had by far the highest number of cycling commuters in both years.
In 2001, well over 43 thousand residents of inner London commuted by bicycle, and this figure rose to more than 106 thousand in 2011, an increase of 144%. By contrast, although outer London had the second highest number of cycling commuters in each year, the percentage change, at only 45%, was the lowest of the twelve areas shown in the table.
Brighton and Hove saw the second biggest increase (109%) in the number of residents cycling to work, but Bristol was the UK’s second city in terms of total numbers of cycling commuters, with 8,108 in 2001 and 15,768 in 2011. Figures for the other eight areas were below the 10 thousand mark in both years.
(172 words, band 9)


