
Graphs – How much vocabulary you know?
Last week lesson was about some structures and vocabulary for process diagram. In today’s lesson, let’s check how much vocabulary you know to write 150 words in task one. Remember, you don’t need to repeat the same words.
| Movement Up & Down | |
| Rose Went up Increased Grew Shot up Surged Rocketed |
Fell Declined Dropped Decreased Sank Went down Plunged Plummeted |
| No movement
remained steady |
|
| Tops and Bottoms
reached a peak |
Adverbs and Intensifiers
slightly |
Now look at the sample of a basic graph to learn more…
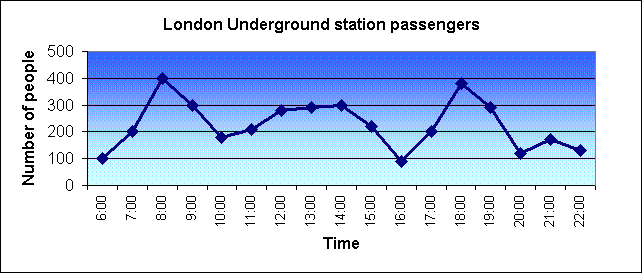
The graph shows the fluctuation in the number of people at a London underground station over the course of a day.
The busiest time of the day is in the morning. There is a sharp increase between 06:00 and 08:00, with 400 people using the station at 8 o’clock. After this the numbers drop quickly to less than 200 at 10 o’clock. Between 11 am and 3 pm the number rises, with a plateau of just under 300 people using the station.
In the afternoon, numbers decline, with less than 100 using the station at 4 pm. There is then a rapid rise to a peak of 380 at 6pm. After 7 pm, numbers fall significantly, with only a slight increase again at 8pm, tailing off after 9 pm.
Overall, the graph shows that the station is most crowded in the early morning and early evening periods.


